
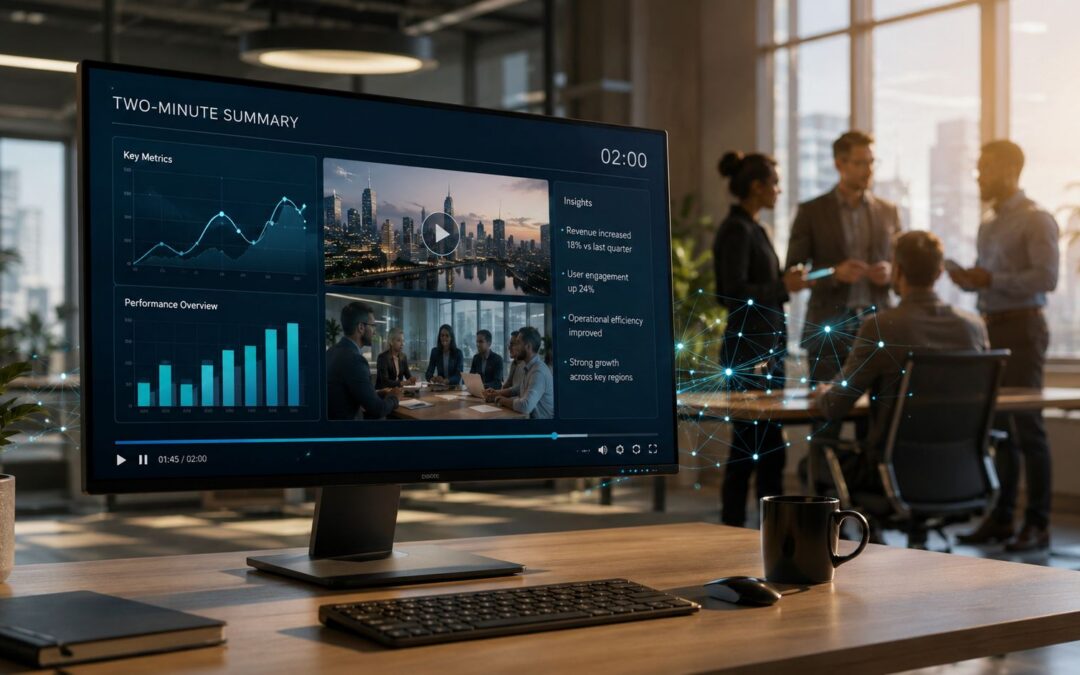
The AI Video Report problem is simple, teams keep rebuilding the same deck every cycle, then wondering why nobody finishes it. A $788.5 million market in 2025 is projected to reach $3.44 billion by 2033, which is a sign that this is no longer a side tool, it’s part of the reporting stack teams are moving toward Grand View Research.
Monday morning usually looks the same. An analyst pulls numbers from the CRM, copies charts into a fresh deck, rewrites the executive summary, and sends a file that gets skimmed once, if it gets opened at all. A short AI Video Report changes that rhythm, because the same data becomes a narrated summary people watch, and when the numbers refresh, the report can be regenerated instead of rebuilt.
The Recurring Report Nobody Watches
At 8:17 a.m., the deck is already stale. CRM exports have been copied into slides, dashboard screenshots pasted in, and the same commentary rewritten for another week of meetings that many will skim and forget.
The wasted time is not just slide design. It is the repeated choreography of collecting exports, checking formulas, aligning charts, fixing labels, and writing the same commentary in a new deck every week. Sales leaders want pipeline movement, marketing wants campaign performance, customer success wants churn risk, and operations wants a clean update, yet each team still ends up with a static document that asks the reader to do the interpretation work. A practical guide to stronger internal communication with video is here: improving internal communication with video.

A AI Video Report fits where the deck fails. It turns the same recurring data into a watched, regenerable summary tied to the business question, instead of packaging raw outputs for another meeting that nobody wants to sit through.
Practical rule: if a report is meant to trigger a decision, it should be easy to finish, easy to resend, and easy to regenerate when the data changes.
The category is already becoming normal in marketing. A 2026 industry summary reported that 63% of video marketers had used AI tools to create or edit marketing videos, up from 51% the prior year, and separate reporting noted that 86% of ad buyers were using or planning to use generative AI for video ad creative Digital Applied. That matters because the old cycle depended on humans doing the same formatting work every week, while the new cycle lets the reporting system do the repeatable work and leaves humans to judge what changed.
For teams that still send a static deck, the cost is attention loss. Stakeholders do not read a 40-slide file with care, they scan, jump to the middle, and miss the point. A two-minute AI video report is not a prettier deck, it is a different operating model.
What an AI Video Report Is
An AI Video Report is a structured, data-bound recorded update built from dashboards, spreadsheets, or CRM exports. It follows a repeatable format, ties each scene to a metric, and regenerates when the source data changes. The point is operational consistency, not a one-off polished clip.
The workflow starts with source data, usually pulled through a connector or CSV export. A template maps each metric to a scene, the narration turns those numbers into plain language, and the output is rendered with branded visuals and controlled voice pacing. A useful reference for the setup logic is the video setup workspace guide, which shows how workspace structure shapes the output before rendering begins.
That matters because recurring reporting breaks when every update becomes a fresh deck build. A video report replaces the rebuild cycle with a format that can be refreshed from the same CRM or dashboard inputs each week, so analysts spend less time reformatting and more time checking what changed.
The roles around it stay separate. The analyst curates the data, the template owner controls structure, and the stakeholder gets a link instead of another file attachment. That separation keeps the report from turning into a design project every time the numbers move.
A strong report system treats narration as a layer on top of data, not decoration after the fact.
For teams using a platform, the Wideo AI video generator is one route for turning structured inputs into a narrated output without hand-editing each cycle. The larger value is the workflow itself. Once the data mapping is stable, the same reporting pattern can serve sales, marketing, finance, onboarding, and internal communications without rebuilding the whole experience each time.
Static Deck Versus Two-Minute Summary
A VP of sales skimming a deck in Slack usually spots the same thing first: too much time spent on formatting, too little on the few numbers that changed. A two-minute summary changes the exchange. People watch it, get the point, and move into the follow-up instead of opening another thread to ask where the update lives.
| Dimension | Static 40-slide deck | Two-minute AI Video Summary |
|---|---|---|
| Production time | Repeated manual formatting, chart cleanup, and rewrite cycles | Template-driven once the structure is set |
| View habit | Often skimmed, forwarded, or ignored | More likely to be finished because it’s short |
| Decision latency | Delayed by reading, searching, and back-and-forth questions | Shorter, because the narrative points to what changed |
| Version control | Decks circulate in email threads and old copies linger | One regenerated version can replace several drafts |
| Feedback loop | Comments arrive late and often fragment across slides | Feedback centers on the narration and the key metrics |
The practical difference is in the workflow. A deck keeps asking analysts to rebuild the same story, then clean it up for each audience. An AI Video Report ties the narration to the same CRM or dashboard inputs, so the weekly update can be refreshed without starting over.
Teams notice the effect in the review meeting itself. Fewer minutes go to locating the right slide, and more go to the decision tied to the metric. For finance, operations, board prep, campaign readouts, and quarterly business updates, that usually means less back-and-forth and a faster route to the next action.
A narrated summary does not replace analysis. It removes the extra repackaging work that turns analysis into a file people tolerate instead of a report they watch.
The Four Mechanics Behind Every AI Video Report
Data ingestion and source discipline
A report only works if the numbers are trustworthy. For a sales team, that might mean pulling pipeline stage data from Salesforce on a schedule, then mapping only the fields that matter to the current meeting, not every field in the CRM. For a finance team, the same logic applies to variance tracking, where the source should be locked before anyone starts narrating the result.
Narration and message order
The narration should explain what changed, what stayed flat, and what needs attention next. A calm voice works better than a dramatic one because stakeholders want a readout, not a trailer. This is also where an AI video report beats a raw screen capture, because the voice can be scripted around the metric story instead of reading labels off a chart.
Formatting consistency and reuse
Branding matters because inconsistency makes leaders question whether the data changed or the template did. Keep the same font treatment, logo placement, scene order, and chart style from week one to week twelve. A clean storyboard helps here, and the how to create a storyboard guide is useful when teams want to lock the structure before production starts.

Distribution and access
The final step is getting the report where people already work. Email, Slack, dashboard embeds, and private links all make sense depending on the audience. The point is to send the same structure every cycle so recipients know where to find the number they care about and don’t need to relearn the format each time.
Building a Recurring Video Reporting Workflow
A recurring workflow starts with one question, what decision is this report supposed to support? If the answer is pipeline review, then the source might be Salesforce, the audience is revenue leadership, and the narration should stay focused on movement, slippage, and next actions. If the answer is onboarding review, the source might be product usage data or support volume, and the story shifts toward adoption and friction.
The process becomes manageable when the template does most of the work. A platform like Wideo can sit between the data source and the final delivery, so the cycle becomes source, template, trigger, render, distribution. That’s the part many organizations don’t have yet, and it’s why they keep recreating the same deck instead of sending the same summary.
A useful way to think about it is repurposing the report, not rewriting it. The repurpose content across platforms workflow model applies here because the same core data can feed different audiences with different pacing, while the underlying structure stays stable.
Start with one recurring report, not five. Choose the source, write a tight script around the deltas, set the render to run before the meeting, and send the result to the channel where the audience already pays attention.

The next step is distribution discipline. If the report gets posted in a Slack channel every Monday morning, people learn to expect it. If it lands as an attachment in a long email thread, it disappears into the noise, which is exactly how good reporting dies.
How Marketing, Sales, CS and Finance Adapt It
Marketing usually wants the campaign story, not a data dump. A marketing AI Video Report can pull spend, impressions, and conversion signals from ad platforms and analytics tools, then narrate which creative is feeding pipeline. Sales wants the same format for weekly pipeline reviews, but the script changes to stage slippage, deal velocity, and quota pacing.
Customer success uses the same skeleton for account health. The narration can surface renewal risk, product adoption movement, and expansion signals from usage and feedback data, which keeps the team focused on intervention instead of status theater. Finance uses the method for monthly variance reporting and board prep, where the message has to stay clean, concise, and grounded in plan-versus-actual movement.
| Function | Primary Data Source | Core Metric in Narration | Typical Audience | Distribution Channel |
|---|---|---|---|---|
| Marketing | Ad platforms, analytics tools | Campaign performance movement | Growth and demand teams | Slack, email, dashboard embed |
| Sales | CRM | Pipeline and quota pacing | Revenue leadership | Private link, email |
| Customer Success | Usage data, support signals | Renewal risk and adoption | CS managers, account teams | Email, internal portal |
| Finance | ERP, planning sheets | Variance against plan | Executives, board prep | Secure link, board package |
For teams working on one-to-one experiences, the personalized video workflow shows how the same reporting logic can be adapted to different viewers without rebuilding from zero. That’s especially useful in ecommerce, insurance, travel, real estate, and SaaS, where the audience often needs the same update in different words.
Measuring, Governing and Scaling the Reporting Cycle
A report only earns its place if people use it. Track view-through rate, completion rate, and stakeholder action rate, because those signals show whether the video was consumed and whether it pushed work forward. If the narration is strong but viewers drop off early, the sequence is too long or the scene order is off.
Governance matters just as much. Lock the script template to a versioned source, limit editing rights to template owners, and keep a clear record of who can change brand assets or data mappings. The guide from Mail Merge for Gmail on sending video summaries through email is a useful reference for teams that want to send visual summaries through email without breaking consistency or deliverability practices.

Scaling starts when the workflow stops depending on one person. Add more templates only after one recurring workflow runs cleanly, then extend to multi-language narration, role-based distribution, and other report types that already follow the same structure. That is how enterprise-ready reporting starts to look, consistent, governed, and repeatable without rebuilding the same deck every week.
For teams that need to turn recurring data reporting into a video summary without starting from scratch each cycle, Wideo’s AI Video Report tool handles structured inputs and branded templates. If your team still rebuilds the same deck every Monday or month-end, visit Wideo and see how a watched report can replace the file nobody opens twice.
Related posts:
 Your Guide to AI Video Generator Technology
 A Guide to AI Video Creation for Beginners
 AI Avatars: The New Face of Business Communication
 AI Avatars: The Secret Weapon for Business Growth and Efficiency
 AI Technology: The New Creative and Strategic Core of Business
 12 Powerful AI Tools for Video Creators in 2025


